Know the player.
Make your case.

The numbers behind your football opinions. Build player cards, compare rivals and put your best XI on the pitch.

Player cards · Head-to-heads · Starting XIs

THE PLAYER FILE2024/25
Kylian Mbappé sample player card with an 83 out of 100 rating
Kylian Mbappé / Real MadridSample export

01 / THE ANALYSIS

Look beyond
the headline number.

Separate playing time from output. Read a player’s rates against the median for their recorded position, then check what the comparison leaves out.

FORWARD PROFILE

Kylian Mbappé

Real Madrid · 2024-2025 · FW

2,907 minutes recorded; meets the 900-minute peer threshold.

What the data shows

  • Highest rank among the displayed metrics: goals at 0.96 per 90, compared with a group median of 0.36.
  • 31 goals against 25.9 expected goals: +5.10 across the recorded season. This difference does not establish repeatable finishing skill.
  • Shot profile: 4.71 shots per 90 versus a peer median of 2.41, with 0.12 non-penalty xG per shot versus 0.13. This separates shot volume from the average quality of recorded chances.
  • Chance creation: 1.58 key passes and 0.24 expected assisted goals per 90; peer medians are 0.99 and 0.11. These measure passes leading to shots and the quality of those shots.

Per-90 rates account for minutes played. They do not account for team possession, opponent strength or tactical duties.

Output and positional benchmarks
MetricPlayerMedianRank
Goalsper 900.960.3697th173 rows
Non-penalty xGper 900.580.3290th173 rows
Expected assisted goalsper 900.240.1187th173 rows
Progressive carriesper 904.641.4590th173 rows
Progressive passes receivedper 9011.955.6295th173 rows
Supporting statistics for the written analysis
Additional recorded evidence
Metric / unitPlayerMedian
Shots · per 904.712.41
Non-penalty xG per shot · xG per shot0.120.13
Key passes · per 901.580.99
How this comparison works

Exact position label FW; at least 900 minutes; includes the selected row when eligible. No league or possession adjustment. Benchmarks require at least five available rows per metric. Missing values stay unavailable. Percentiles use midpoint ties; a high event count is not necessarily better defending.
Download the exact analysis data (JSON) · Read the method

FULL-BACK-LIKE · INFERRED PROFILE

Trent Alexander-Arnold

Liverpool · 2024-2025 · DF

2,365 minutes recorded; meets the 900-minute peer threshold.

What the data shows

  • Full-back-like profile, inferred from the stats: crosses 5.82 per 90 versus a defender median of 0.75; attacking-third share of touches 29.31% versus a defender median of 14.36; aerial contests 0.61 per 90 versus a defender median of 2.53. The data does not establish left or right side.
  • Passing contrast: 8.83 progressive passes per 90 against a median of 3.35, alongside 73.5% pass completion against 84.65%. Completion alone does not account for pass difficulty.
  • Ball-winning volume: 3.92 tackles plus interceptions per 90 versus 2.71 for peers; interceptions account for 1.18 per 90 versus 1.02. More defensive actions can reflect more time spent defending, rather than greater efficiency.
  • Aerial record: 3 of 16 contests won, with a recorded success rate of 18.8% versus a peer median of 55.6%. Read that percentage alongside the 16-contest sample.

Role estimates compare all defender labels; the main table compares the exact recorded position. Per-90 rates account for minutes played. They do not account for team possession, opponent strength or tactical duties.

Output and positional benchmarks
MetricPlayerMedianRank
Tackles + interceptionsper 903.922.7191st532 rows
Progressive passesper 908.833.3599th532 rows
Progressive carriesper 901.940.8983rd532 rows
Interceptionsper 901.181.0265th532 rows
Aerial duels won%18.855.6<1st532 rows
Pass completion%73.584.658th532 rows
Crossesper 905.820.4597th532 rows
Crosses into penalty areaper 900.760.0994th532 rows
Inspect the defender role estimate

Full-back-like profile inferred from season statistics. The leading signal group averages 87/100, with a 73-point gap. This identifies a statistical tendency, not a confirmed position or side.

Defender role signals
Signal / unitPlayerMedian
Crosses · per 905.820.75
Progressive carries · per 901.941.05
Attacking-third share of touches · %29.3114.36
Clearances · per 902.093.49
Aerial contests · per 900.612.53
Defensive-third share of touches · %26.3336.36

631 defender rows with at least 900 minutes. Six equally weighted percentile signals within eligible defenders: crosses, progressive carries and attacking-third touch share versus clearances, aerial contests and defensive-third touch share. At least 900 minutes, 30 defender rows and 20 available rows per signal. Each profile averages its three signals and the complements of the opposing three. A role hint needs all six signals, a leading score of at least 65 and a gap of at least 20 points, with two supporting signals at or above 65. These heuristic scores are not probabilities. Team tactics affect the figures; side and exact duties require position data or video.

The estimate selects extra analysis metrics. The model rating still uses the recorded general defender profile.

How this comparison works

Exact position label DF; at least 900 minutes; includes the selected row when eligible. No league or possession adjustment. Benchmarks require at least five available rows per metric. Missing values stay unavailable. Percentiles use midpoint ties; a high event count is not necessarily better defending.
Download the exact analysis data (JSON) · Read the method

02 / THE COMPARISONS

Find the difference.
Show the evidence.

Compare players across the full statistical profile, or examine two selected XIs. Every example shows the sample, units and limits behind the numbers.

PLAYER COMPARISON

Mbappé & Haaland

2024-2025 · FW · 900+ minutes

66.9/100Statistical similarity index

83 shared features · 83 active · 83 configured · 173 forward rows

What separates their profiles?

  • Switches: 0.59 vs 0 per 90. Accounts for 6.9% of the squared profile gap.
  • Touches in attacking third: 34.49 vs 12.63 per 90. Accounts for 4.2% of the squared profile gap.
  • Progressive passes received: 11.95 vs 4.08 per 90. Accounts for 3.9% of the squared profile gap.

The index describes statistical proximity, not player quality or the probability of a match. Related features overlap.

Largest differences in the full vector
Metric / unitMbappéHaaland
Switches · per 900.590
Touches in attacking third · per 9034.4912.63
Progressive passes received · per 9011.954.08
Carries · per 9032.9710.2
Progressive carrying distance · yards per 90117.8918.98
Carrying distance · yards per 90216.3249.14

Mbappé: 2,907 minutes. Haaland: 2,736 minutes. Counts are converted to per 90; existing rates stay unchanged.

Data & comparison basis

Counts per 90; existing rates and ratios unchanged. Min–max scaling within the selected cohort, then RMS distance over shared axes. At least ten shared axes and 80% coverage required. Related statistics overlap; this is statistical proximity, not a probability, quality rating or proof of the same tactical role. No league or possession adjustment. Method: per90-minmax-rms-v2. Cohort: exact FW label, at least 900 minutes. Fixed example from the bundled season; full interactive selection is in the app.

Download sample data and source hashes (JSON). Read the sample methodology.

TWO SELECTED XIs

Liverpool & Arsenal

2024-2025 · 1–4–3–3 · 900+ minutes per player

22 selected players.
Goalkeepers compared separately.

Where the selected profiles differ

  • Liverpool selection records 0.14 more progressive passes per 90 per outfield player than Arsenal selection.
  • Liverpool selection records 0.01 more progressive carries per 90 per outfield player than Arsenal selection.

Means of individual season rates. These are not observed team totals or a match prediction. No possession or league adjustment.

Outfield means · 10/10 available per metric on both sides
Metric / unit LIV ARS
Progressive passes · per 905.14.96
Progressive carries · per 902.252.24
Non-penalty xG · per 900.190.16
Expected assisted goals · per 900.180.11
Tackles + interceptions · per 902.451.99
Pass completion · %82.5583.89

Between the posts

Alisson / David Raya

Goalkeeper season profiles · all four metrics available
Metric / unit LIV ARS
Save percentage · %7274.2
Post-shot xG minus goals allowed · per 900.130.03
Crosses stopped · %4.313.2
Actions outside penalty area · per 90 (recorded)1.761.74

Positive post-shot xG minus goals allowed means fewer goals conceded than the model expected. Sweeper actions and cross stopping also depend on opportunity and role.

Inspect both selected XIs and minutes
Liverpool selection
Slot / playerMinutes
GK · Alisson2,508
DF1 · Virgil van Dijk3,330
DF2 · Ibrahima Konaté2,560
DF3 · Andrew Robertson2,482
DF4 · Trent Alexander-Arnold2,365
MF1 · Ryan Gravenberch3,160
MF2 · Alexis Mac Allister2,599
MF3 · Dominik Szoboszlai2,491
FW1 · Mohamed Salah3,371
FW2 · Luis Díaz2,399
FW3 · Cody Gakpo1,935
Arsenal selection
Slot / playerMinutes
GK · David Raya3,420
DF1 · William Saliba3,039
DF2 · Jurriën Timber2,417
DF3 · Gabriel Magalhães2,363
DF4 · Myles Lewis-Skelly1,369
MF1 · Declan Rice2,825
MF2 · Thomas Partey2,797
MF3 · Martin Ødegaard2,325
FW1 · Leandro Trossard2,546
FW2 · Gabriel Martinelli2,290
FW3 · Kai Havertz1,875

Primary recorded position takes priority, followed by season minutes. Mixed labels may fill either group. These are example selections, not official starting lineups. DF does not identify centre-back or full-back duties.

Data & comparison basis

Equal-weight means of ten selected outfield players' season rates. Percentages are means of individual percentages, not team event-weighted rates. At least eight available players are required per metric; partial coverage is labelled. Goalkeepers are separate. No possession, opponent or league adjustment. These players need not have played together; this is not a measured team performance or match forecast. Method: selected-xi-mean-rates-v1. Fixed selections from the bundled season; edit both XIs in the app.

Download sample data and source hashes (JSON). Read the sample methodology.

03 / THE OUTPUT

Let the numbers talk.

Real exports, with the same numbers in readable tables. Check the season and comparison basis, then download a card.

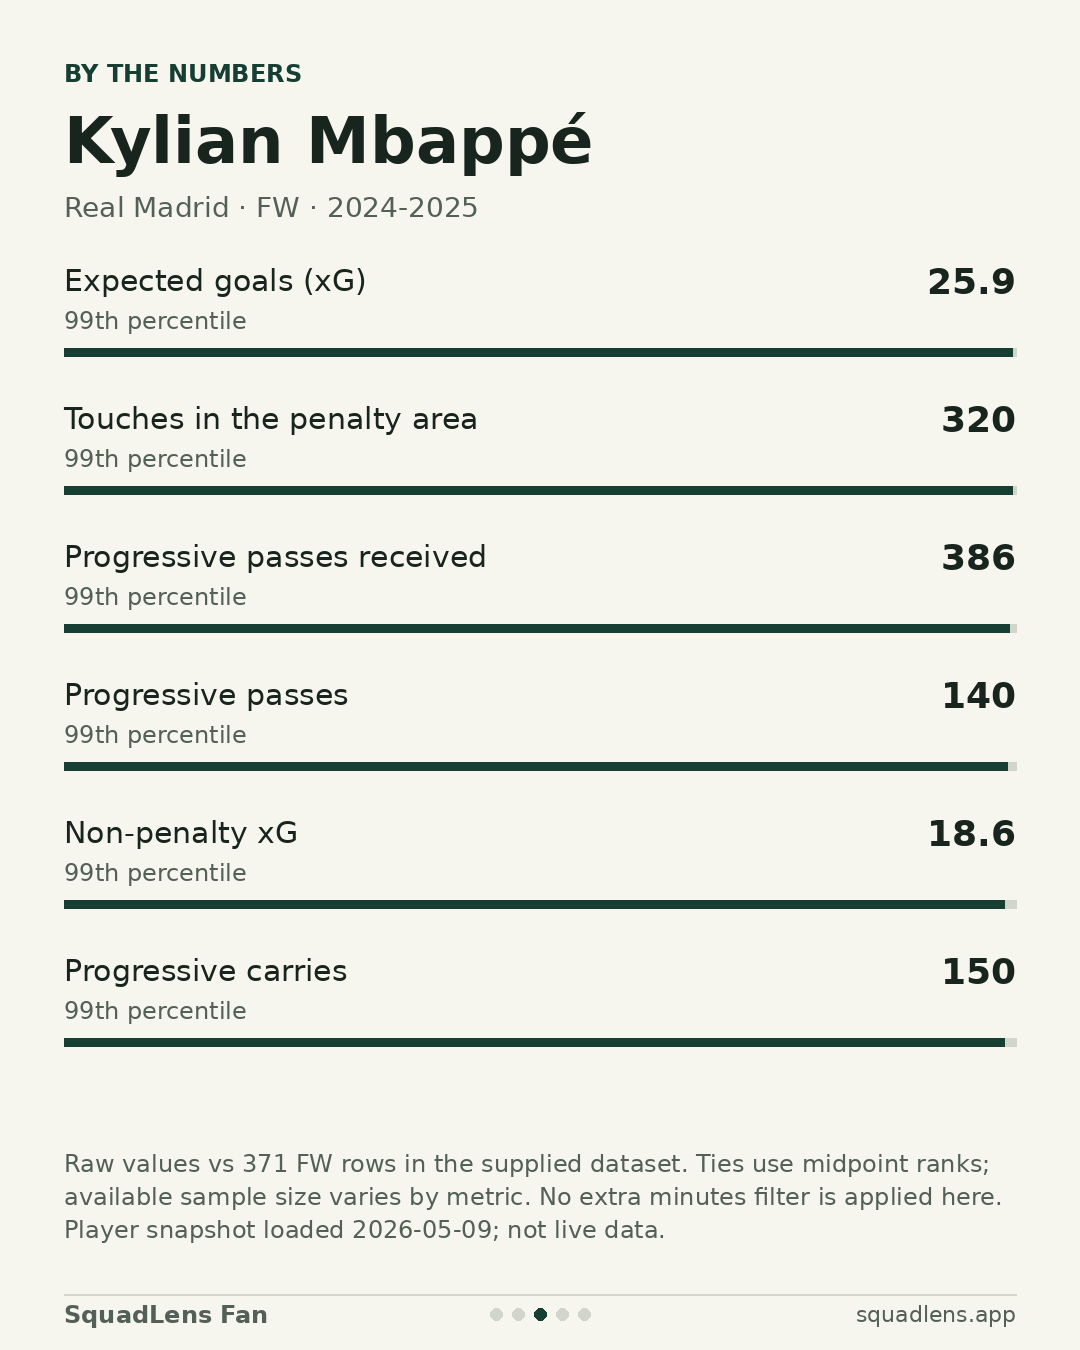
Kylian Mbappé by-the-numbers card with positional percentile bars

PLAYER BREAKDOWN

A season,
in perspective.

See where a player stands against their positional peers. Percentile bars put the numbers in context, from finishing to ball progression.

Kylian Mbappé · 2024-2025 · 2,907 minutes
MetricTotalRank
Expected goals (xG)25.999th
Touches in the penalty area32099th
Progressive passes received38699th
Progressive passes14099th
Non-penalty xG18.699th
Progressive carries15099th

Percentile ranks against 371 rows labelled FW. Six highest-ranked metrics; no minimum minutes filter.

Data & comparison basis

Bundled 2024-2025 player data, loaded 2026-05-09. This is the snapshot load date, not the last match date. The original supplier and collection date are not recorded in the manifest. Ranks use raw season totals across the five leagues, with half of tied rows counted below. Each of these six metrics has 371 available rows. Related metrics are not independent measures of quality. The model rating also uses 2025/26 Elo data.

Download sample data and source hashes (JSON). Read the sample methodology.

View full-size image

Download sample

Fixed season sample. PNG download; not a live feed.

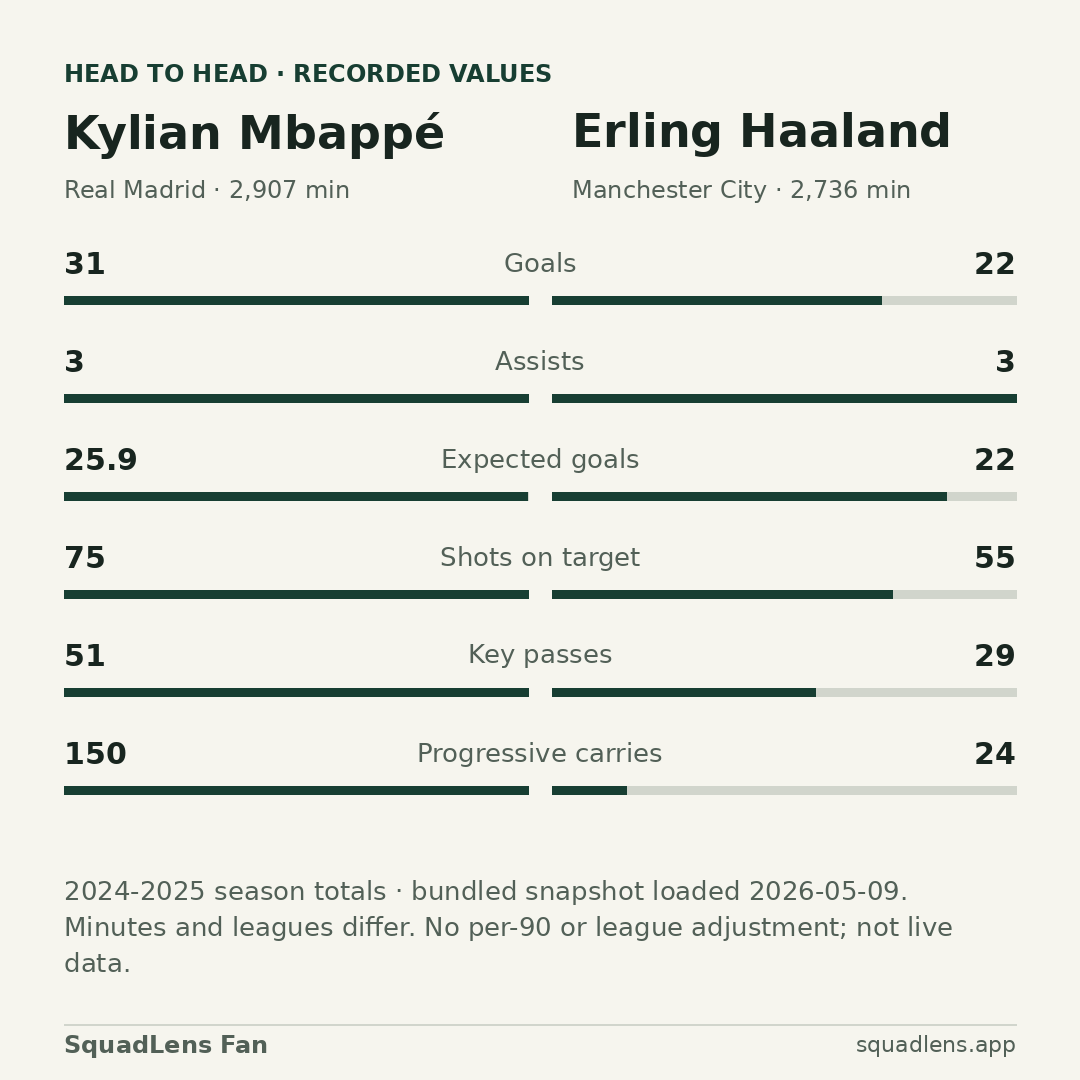
Kylian Mbappé and Erling Haaland: 2024/25 totals for six attacking metrics; values repeated in the adjacent table

HEAD-TO-HEAD

Two players.
The numbers side by side.

Put players side by side using metrics that fit their roles. Here, compare two forwards’ season totals alongside their minutes played.

2024-2025 season totals
MetricMbappéHaaland
Goals3122
Assists33
Expected goals25.922
Shots on target7555
Key passes5129
Progressive carries15024

Mbappé: 2,907 minutes for Real Madrid. Haaland: 2,736 minutes for Manchester City. Totals are not adjusted for playing time or league strength.

Data & comparison basis

Bundled 2024-2025 player data, loaded 2026-05-09. This is the snapshot load date, not the last match date. The original supplier and collection date are not recorded in the manifest. Raw season totals; not adjusted per 90 or for league strength. These six metrics do not produce an overall player ranking.

Download sample data and source hashes (JSON). Read the sample methodology.

View full-size image

Download sample

Fixed season sample. PNG download; not a live feed.

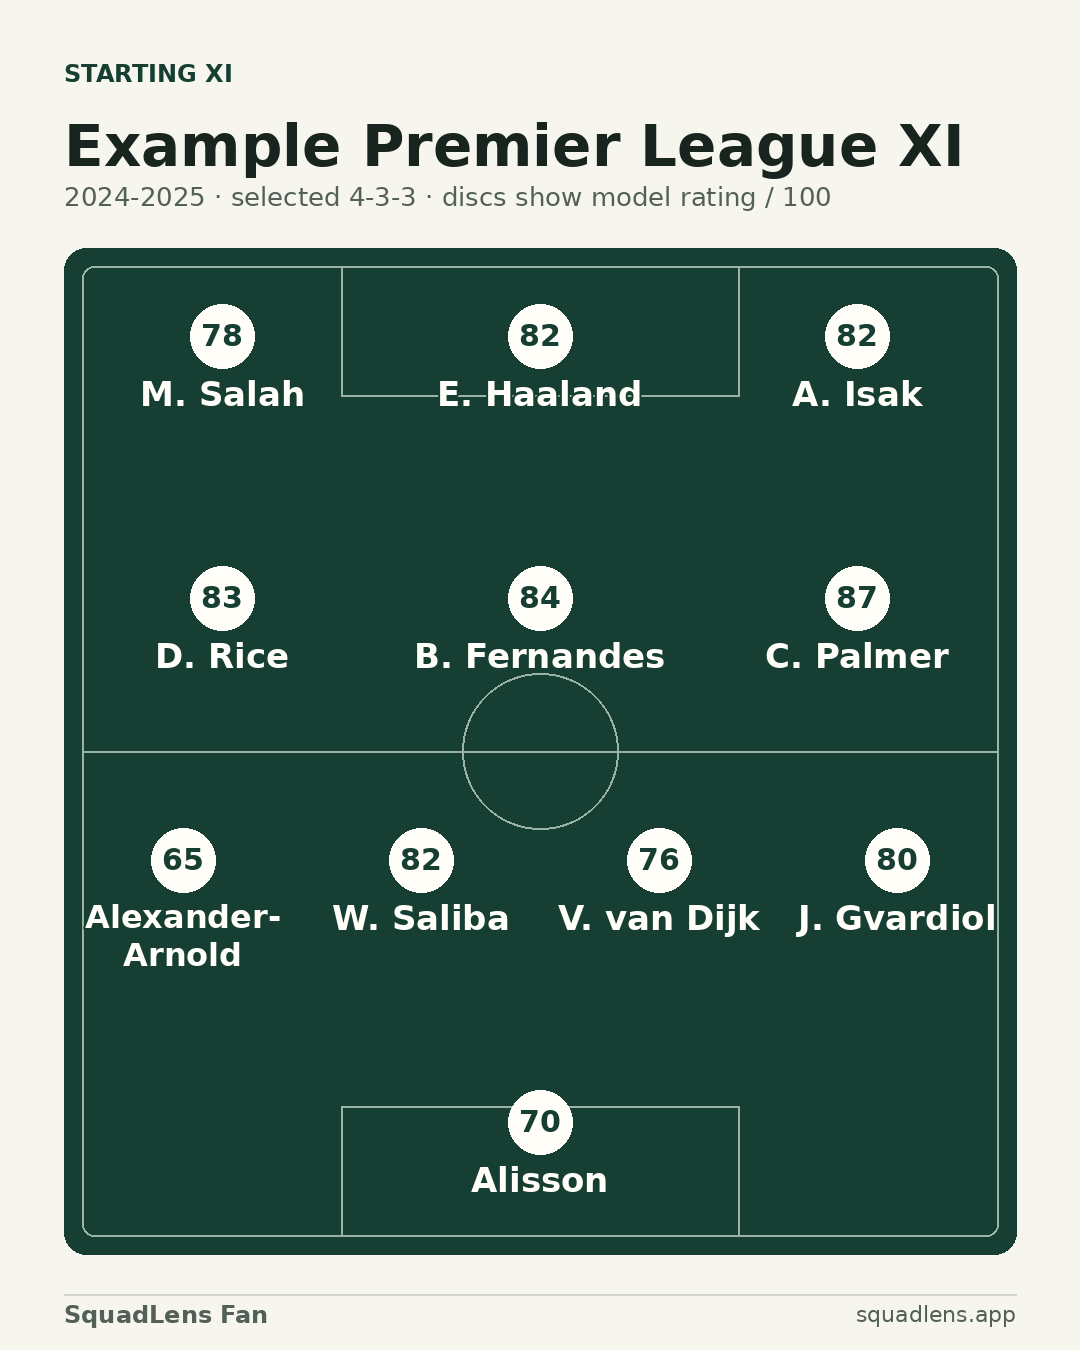
Manually selected Premier League example XI with model ratings; full player names and ratings in the adjacent table

STARTING XI

Your picks.
On the team sheet.

Choose your own lineup or build a rated XI from the available players. Export the formation with player names, positions and ratings.

Full team sheet and ratings · 11 players
Example 4-3-3 · 2024-2025 players
Position / playerRating
GK · Alisson70/100
DF · Trent Alexander-Arnold65/100
DF · William Saliba82/100
DF · Virgil van Dijk76/100
DF · Joško Gvardiol80/100
MF · Declan Rice83/100
MF · Bruno Fernandes84/100
MF · Cole Palmer87/100
FW · Mohamed Salah78/100
FW · Erling Haaland82/100
FW · Alexander Isak82/100

Manually selected to demonstrate the export. This is not a live team of the week or a highest-rated XI.

Data & comparison basis

Bundled 2024-2025 player data, loaded 2026-05-09. This is the snapshot load date, not the last match date. The original supplier and collection date are not recorded in the manifest. Role-specific difficulty-adjusted performance, age and minutes; missing injury history is neutral. Elo uses 2025-2026 matches.

Download sample data and source hashes (JSON). Read the sample methodology.

View full-size image

Download sample

Fixed season sample. PNG download; not a live feed.

04 / THE TOOLS

Follow your football curiosity.

Start with a player, a comparison or a team. Each tool gives you a different way to read the season.

From the first stat
to the final XI.

  1. Post Studio

    Turn a player’s season into a carousel, with stats and a caption to go with it.

  2. Stat Leaders

    Rank players by goals, expected goals, progression and more. Filter by league and position.

  3. Rising Stars

    Set an age limit and find young players standing out in the available data.

  4. Head-to-Head

    Inspect the 83-feature profile, per-90 differences and closest statistical neighbours.

  5. Team of the Week

    Generate an XI by rating from the loaded dataset. Ratings reflect that dataset, not a live matchweek feed.

  6. Build and compare XIs

    Select two complete teams. Compare outfield season rates and goalkeeper profiles, with every player and minute count visible.

05 / THE DETAILS

Before you kick off.

Read the methodology
Can I try the tools on this website?

This is the SquadLens showcase. You can explore fixed player and team comparisons and download sample cards here. To use the analysis tools, request app access.

Where do the numbers come from?

These examples use the bundled 2024/25 player dataset. Each example includes a readable table and its comparison basis. Ratings also use 2025/26 Elo data. See the sample sources and limitations.

What does a player’s rating mean?

It summarises performance using role-specific statistics and supporting signals such as minutes played. It is a comparison aid, not a transfer valuation. See how to read the numbers.